Dashboard
The dashboard is the main landing page for the Intelligence Hub. It provides a high level overview of the following:
- Current connection and pipeline statuses
- Intelligence Hub version, last restart time, and connected agent versions
- JVM memory, CPU, and thread usage
- Key configuration settings
- Recent logs
- Time series charts of error logging
- Aggregate counts of conditions, models, instances, namespaces, connections, and pipelines
Dashboard Widgets
Hub
The Hub widget shows the current Intelligence Hub version, the last restart time, and versions of any connected agents (e.g., PI Agents). The Hub widget can be useful to quickly spot and update outdated agent versions.
Connections
The Connections widget provides a synopsis of all active connections in the Intelligence Hub, along with any active errors that need to be resolved.
If a connection is in error, click anywhere on its alert to go directly to the connection details. When no active connections are in error, the widget displays a healthy indicator.


Pipelines
The Pipelines widget provides a synopsis of all active pipelines in the Intelligence Hub, along with any active errors that need to be resolved or dismissed.
If a pipeline is in error, click anywhere on its alert to go directly to the pipeline details. When all pipelines run without errors, the widget displays a healthy indicator.
Overview
The Overview widget displays aggregate counts of all configured connections, conditions, models, instances, namespaces, and pipelines (active and inactive).
Click any row to navigate to the respective page to add, remove, or edit that item type.
JVM
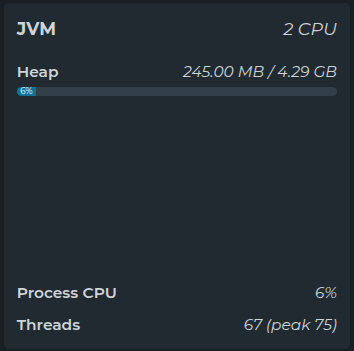
The JVM widget shows the resource usage of the Java Virtual Machine (JVM) running the Intelligence Hub. Use it as a quick first check when troubleshooting performance, without having to attach an external monitoring agent such as OpenTelemetry.
| Metric | Description |
|---|---|
| CPU | Shown in the widget header. The number of processors available to the JVM. In containers this reflects the CPU limit applied to the container. |
| Heap | The heap memory in use and the maximum heap size, with a bar showing the percentage used. When the JVM has no maximum heap size, only the memory in use is shown. |
| Process CPU | The CPU load of the Intelligence Hub process as a percentage of all available processors. Shows n/a when the operating system does not report it. |
| Threads | The number of live threads, and the peak thread count since the Intelligence Hub started. |
The same values, plus additional memory, garbage collection, and uptime metrics, are available as a reference under System.Internal.JVM. See Status & Metrics for details.
High Availability
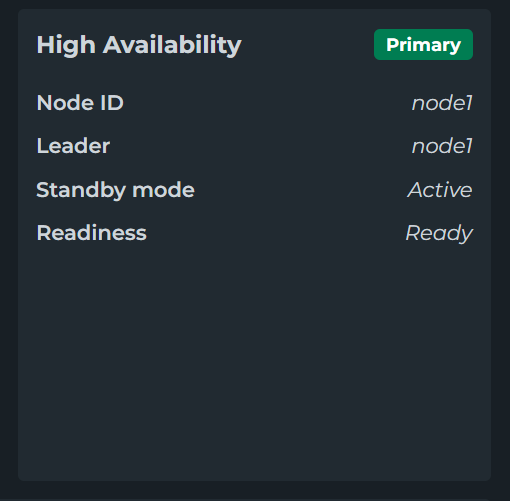
The High Availability widget shows where this node stands in its High Availability cluster. It is only shown when the hub runs as part of a cluster.
The widget header shows whether this node is the Primary or a Secondary.
| Metric | Description |
|---|---|
| Node ID | The unique node ID of this node. |
| Leader | The node ID of the current primary, or None when the cluster has no primary. |
| Standby mode | The standby mode of the cluster, Passive or Active. See Standby Modes. |
| Readiness | Whether this node is ready to process data. Hover over Not ready for the reason. In an active cluster, a node cannot become the primary until it is ready. |
Logs
The Logs widget lists the most recent Intelligence Hub log entries including level (error, warning, info), relative timestamp, source, and message.
Click a log row to navigate to the Log Events page, filtered to that log timestamp and preceding log entries.

Writes Per Hour
The Writes Per Hour widget displays the aggregate write throughput, across all connections/outputs, for the past 24 hours. Only successful writes are included, failed or pending writes are not included. Hover over a bar to see the exact count by hour.

Error Logs Chart
The Error Logs widget charts error counts for the past 24 hours. Hover over a bar to see the total for that hour. Click a bar to navigate to the Log Events page, filtered to the selected hour.

Store & Forward
The Store & Forward widget lists all connections with Store & Forward enabled. For each connection with pending writes, it shows the pending write count. It also displays the total allocated Store & Forward storage across all connections. Store and Forward uses SQLite to persist messages to disk. The “Allocated” space reflects the memory SQLite has reserved for Store & Forward, not the amount currently in use. By default, SQLite does not release allocated space after messages have been processed or removed. This can be reclaimed on demand via the “Clear Selected” button, though doing so is not recommended under normal operation. If no connections have Store & Forward enabled, the widget will be hidden.

Settings
The Settings widget shows whether each listed Hub setting is enabled or disabled.
Click a row to navigate directly to that setting on the Settings page.
